A State Note at 3,70 %: the real cost is the potential you give up
Mathias Schmit et Kristof Szechy·3 September 2026·8 min read
3,70 % over ten years looks generous. Once tax and inflation are counted, almost nothing is left. And the real question lies elsewhere: what a portfolio gives up by betting everything on bonds.
The Belgian State Note to be issued on 4 September 2026 carries a coupon of 3,70 % over ten years [1], the highest of the three issues this year. Before celebrating, two simple calculations are in order: what is actually left of that figure, and what this investment costs in missed opportunities.
Three issues, one and the same trend
Belgian State Note rates have been rising since the start of the year, on both maturities on offer:
Gross rates on Belgian State Notes, issued or open for subscription in 2026. Sources: official releases from the Federal Debt Agency [1][2][3].
Issue
1-year note
Long maturity
March 2026
2,00 %
2,80 % (8 years)
June 2026
2,50 %
3,30 % (8 years)
September 2026
2,75 %
3,70 % (10 years)
One caveat when reading this table: the long maturity moves from eight to ten years between June and September. Part of the increase therefore comes from the longer term and not only from market movements. That said, this 3,70 % coupon remains the highest offered on this type of security since 2012 [4].
What is actually left
Take 10.000 EUR invested in the ten-year note. The 3,70 % coupon pays 370 EUR a year. Two effects then cut into that amount.
The first is visible: withholding tax, the tax the bank automatically deducts from interest. It stands at 30 % in Belgium and therefore takes 111 EUR. That leaves 259 EUR, a net return of 2,59 % [5].
The second is invisible: inflation. It takes nothing from the account but it reduces what the money can buy. With inflation at 2 % a year, those 2,59 % net translate into a gain of roughly 0,6 % in real purchasing power. If inflation is taken at 3,56 %, the level recorded in July 2026 [6], purchasing power falls by about 0,9 % a year despite the coupon being collected. In other words: the investment can erode purchasing power while still paying interest.
The coupon itself is fixed and known in advance. That does not make the investment risk free: repayment at face value is only due at maturity and only provided the Belgian State honours its commitments. Before that date the price of the security follows the market, and a sale can take place below the amount invested [5].
The forgone potential
Over the past 98 years (1928-2025), the US stock index S&P 500 returned an average of 10,0 % a year in dollars with dividends reinvested, against 4,5 % for ten-year US Treasury bonds, according to data published by Aswath Damodaran, professor of finance at NYU Stern School of Business [7]. More than double, then, in average annual return.
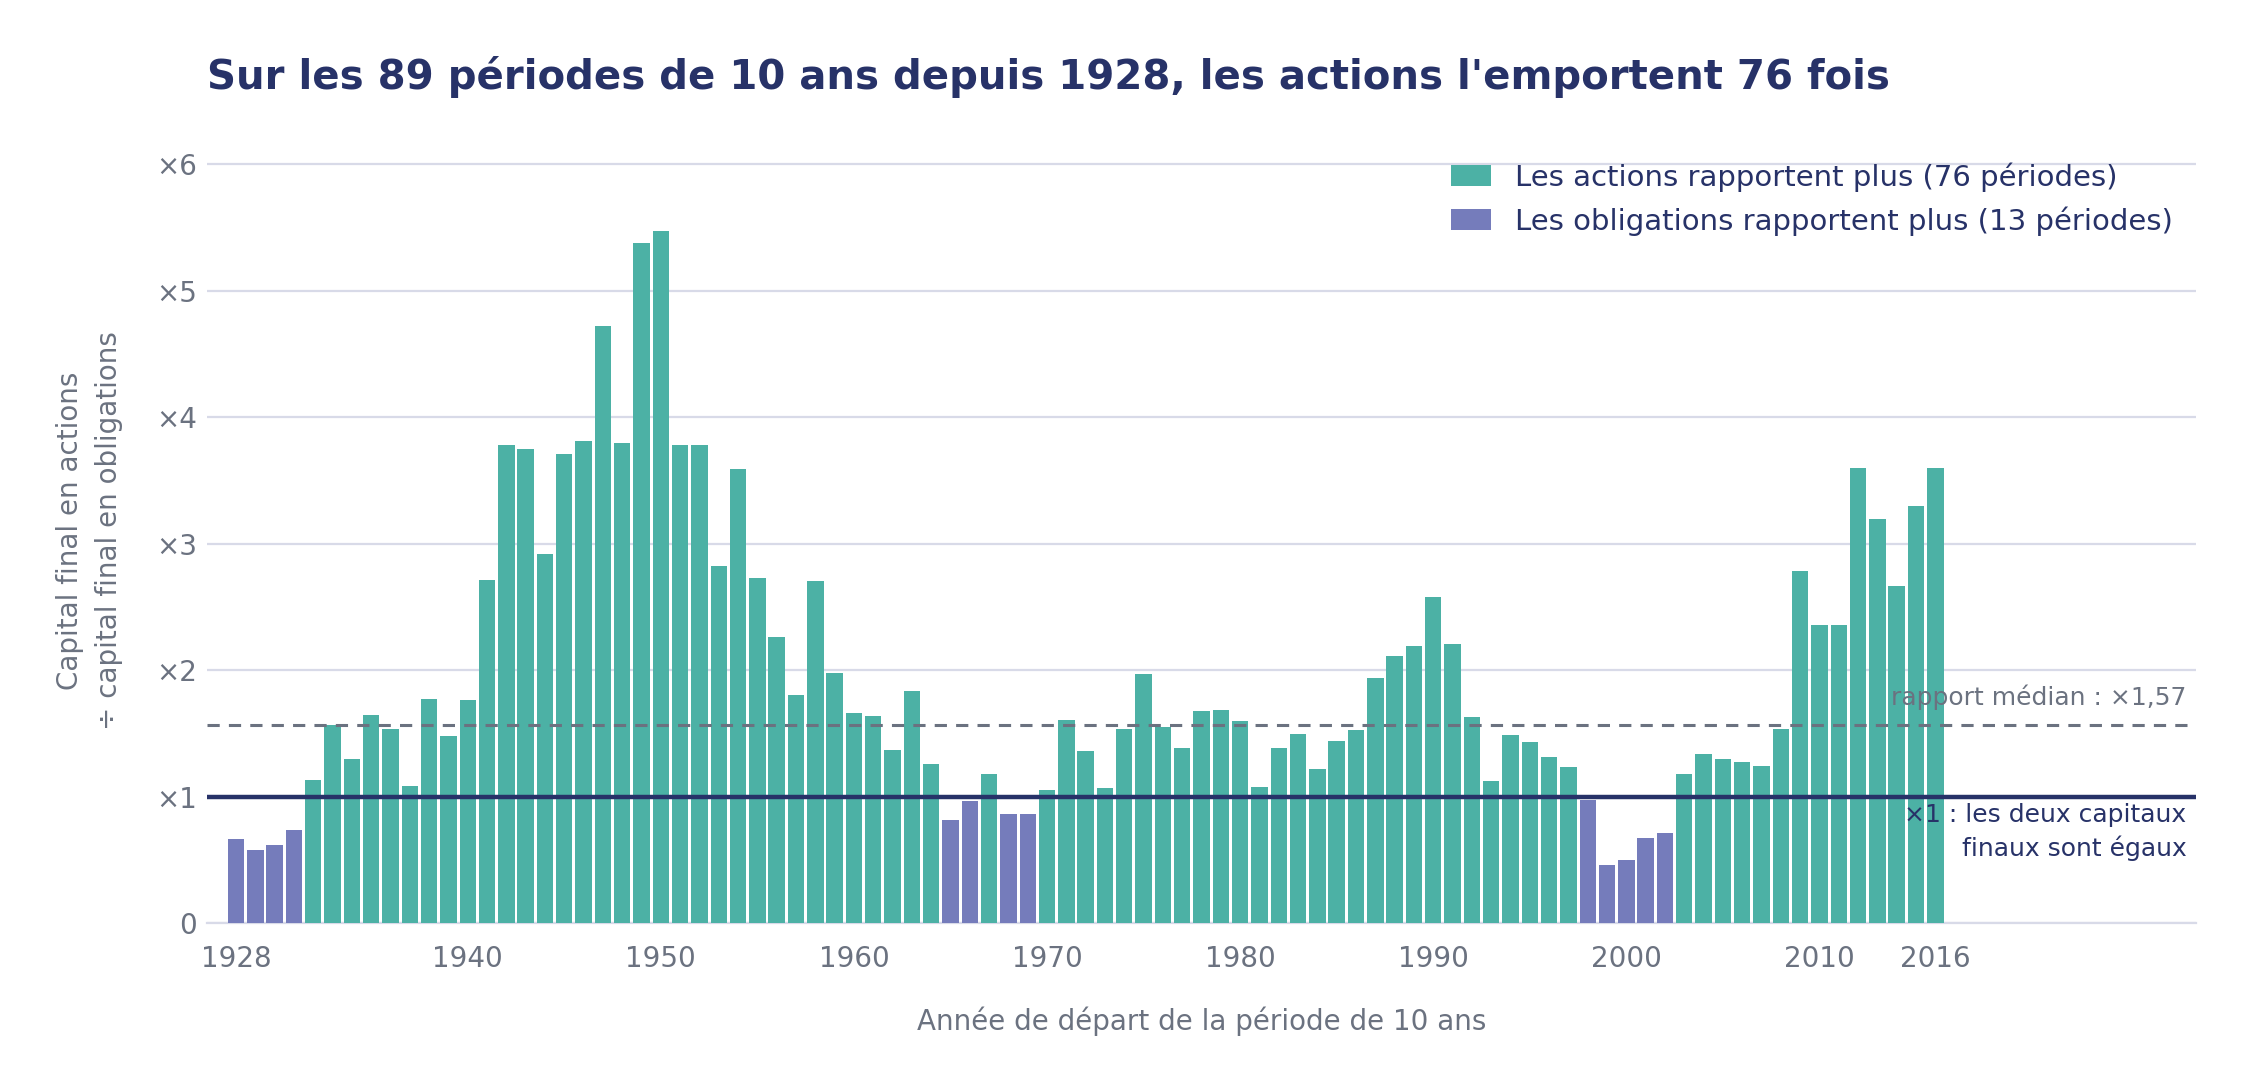
That century-long average does not, however, tell us what a saver would have earned over ten years, the term of the State Note. So we computed the 89 possible ten-year periods between 1928 and 2025: 1928-1937, then 1929-1938 and so on through to 2016-2025. Each bar in the chart below compares the outcome of the two investments over one of those periods.
How to read this chart: each bar represents a 10-year period, identified by its starting year; the bar at 1994 therefore compares the results obtained between 1994 and 2003. A bar at ×2 means the final capital in equities is worth twice the capital obtained in bonds. Below the ×1 line, bonds come out ahead. Source: Aswath Damodaran (NYU Stern), Historical Returns on Stocks, Bonds and Bills 1928-2025; nominal returns in dollars, dividends reinvested for equities, ten-year US Treasury bonds; Sagora calculations [7].
Equities come out ahead in 76 periods out of 89. The median ratio between the final capital amounts is 1,57: in half of the periods, the final capital in equities was at least 1,57 times the capital obtained in bonds.
The 13 periods in which bonds win deserve just as much attention. They are not scattered at random: they cluster around the 1929 crash, the years 1965-1978 and the decade 1998-2011, marked by two stock market crashes. The period with the most unfavourable gap is 1999-2008: 10.000 EUR invested in equities was worth no more than 8.700 after ten years, against 18.900 in bonds. The risk is therefore not theoretical.
Three points on method. The bond return corresponds to a theoretical exposure to US Treasury bonds at a constant ten-year maturity, and not to a single note held to maturity such as the September 2026 one. These results are expressed in dollars, before fees, before the tax treatment specific to each investment vehicle and without any currency effect. Finally, these periods overlap, so a single year influences several neighbouring bars: the chart describes what happened and does not constitute a probability for the decade ahead.
Even after tax and inflation, the gap remains significant
An ETF tracking the S&P 500 does not escape the taxman either. It is subject to the stock exchange tax on every transaction and, since 2026, to the same 10 % capital gains tax as a State Note sold before maturity. The 10.000 EUR annual exemption is not, incidentally, specific to each product: it is an overall threshold per taxpayer, covering all capital gains realised during the year, equities, ETFs and bonds combined [8][9].
The tax treatment is nevertheless not identical on both sides. The coupon on a bond is taxed at 30 % every year. An accumulating ETF pays no dividend to the investor: its return comes from the capital gain, taxed at only 10 % and only on the day it is sold. For distributing ETFs, on the other hand, the dividends paid out are indeed subject to the 30 % withholding tax, just like the coupons on a State Note.
Across the 89 historical ten-year periods, the advantage lies mostly, though not systematically, with the S&P 500. In an illustrative scenario based on the average of the past century, the real return on equities would nevertheless remain well above that of the State Note, which sits between -0,9 % and +0,6 % depending on the inflation assumption. That argues for keeping an exposure to growth where the horizon and the risk tolerance allow it, without any guarantee that this advantage will repeat over the next ten years.
So what are bonds for?
Not primarily for maximising capital growth at this level of real return. Their usefulness lies elsewhere and it has a name: diversification.
The principle is simple. Two investments that rise and fall at exactly the same time offer no protection: when one drops, the other drops too. If their movements are not linked, part of the shock can instead be absorbed. That is what correlation measures, an indicator running from -1 to +1: close to +1, the two assets move in the same direction; close to 0, there is no marked linear relationship between their movements; negative, they tend to move in opposite directions.
Over the 98 years of the Damodaran series, the correlation between the S&P 500 and ten-year government bonds is 0,02, in other words close to zero [7]. There is therefore no marked linear relationship between their movements. This low correlation can reduce the risk of a portfolio at a given expected return, without guaranteeing that one asset will rise when the other falls. The detail is even more telling: over the 26 years in which the S&P 500 ended in the red, bonds were positive 21 times, four years out of five. In 2008, at the heart of the financial crisis, equities lost 36,6 % while bonds gained 20,1 %.
This protection is not automatic, however. There remain five years out of 98 in which both fell together, and the most recent is also the most brutal: in 2022 the inflation shock cost equities 18,0 % and bonds 17,8 % simultaneously [7]. When inflation surprises and interest rates rise fast, both asset classes suffer at the same time.
A bond can therefore act as a shock absorber and not as an engine of performance. The question is not whether 3,70 % is a good rate in absolute terms, but which share of the portfolio deserves that shock-absorbing role and which share should stay exposed to growth. Putting everything into bonds out of a reflex of caution has a cost: the potential you give up.
Sources
[1] Federal Debt Agency (official release), State Notes 4 September 2026, coupons, news.belgium.be, 24 August 2026. news.belgium.be
[2] Federal Debt Agency (official release), issue of 4 March 2026, news.belgium.be. news.belgium.be
[3] Federal Debt Agency (official release), issue of 4 June 2026, news.belgium.be. news.belgium.be
[4] RTBF, Amid Faljaoui, Le bon d’État à 3,7 % : bonne affaire ou faux ami ?, economic column, 25 August 2026. rtbf.be
[5] Federal Debt Agency, product information (State Notes) and tax FAQ, accessed 27 August 2026. debtagency.be
[6] Statbel, inflation stands at 3,56 %, official release, July 2026. statbel.fgov.be
[7] Aswath Damodaran, NYU Stern School of Business, Historical Returns on Stocks, Bonds and Bills: 1928-2025, data updated on 5 January 2026. Geometric averages, correlation, cumulative values and annual statistics calculated by Sagora from the raw data file. pages.stern.nyu.edu
[8] FPS Finance, the tax on capital gains on financial assets, official page. fin.belgium.be
[9] Curvo, Taxes for Belgian investors: what you need to know, tax guide (unofficial source, mechanics of the stock exchange tax and of the withholding tax on dividends), 2026. curvo.eu
The right allocation matters as much as the right product
Sagora trains company leaders and informed savers on exactly this question: how to split a portfolio across asset classes according to horizon, risk and objective, rather than judging each investment in isolation. That is the subject of our Portfolio management programme. Let’s talk.
Sagora Finance, editorial line. An analytical stance, with an educational purpose. Neither personalised investment advice nor a recommendation to buy or sell. Rates and inflation data are dated and may change. The historical averages quoted are no guide to future performance.
State NotesPortfolio managementDiversificationBondsEquitiesS&P 500inflationwithholding taxasset allocation