
Ziegler bankruptcy: three signals every leader must read
Behind Ziegler's bankruptcy, its 2024 accounts already revealed three signs of strain. A concrete framework for any leader who wants to see it coming: the structure of the balance sheet and the net cash position, EBITDA and the map of cash flows.
Accounting tells one story. Cash tells another, and it is often the only one that decides whether a company survives. Adopting a cash culture means no longer reading your accounts like an accountant closing a financial year, but reading them like a leader who has to pay their suppliers on Monday morning.
Take two dates. On 1 June 2026 the Belgian carrier Ziegler filed for bankruptcy. Eleven months earlier it had filed its 2024 statutory accounts with the National Bank of Belgium. Those accounts showed a positive EBITDA of 2.55 million euros. They also showed a closing cash position that had fallen to 0.434 million against 28.69 million euros of short-term financial debt. The income statement remained presentable. Cash, however, had already spoken.
This article isolates three signals that every leader should know how to read in their own accounts: the structure of their balance sheet and their net cash position, their EBITDA and the map of their cash flows. Three simple readings that set apart the companies that see it coming from those that find out.
We take Ziegler SA as a teaching case, never as a trial. The analysis covers the statutory entity Ziegler SA alone (company number CBE BE 0403.480.507, 323 people at the end of 2024), distinct from the Ziegler group (around 3,200 people in 16 countries) and from the other Belgian entities targeted by the proceedings. The carrier was founded in Brussels in 1908, with the legal entity incorporated in 1937. Nearly one hundred and twenty years of activity does not exempt anyone from steering cash.
Signal 1: the structure of the balance sheet and the net cash position
A cash culture begins with a question put to the balance sheet: what is financing what? Three figures answer it, and they must be told apart.
Net working capital measures the stable resources that remain once long-term assets are financed. At Ziegler it is negative at 4.77 million euros, after 4.14 million a year earlier: the fixed assets are not fully covered by long-term resources. The working capital requirement represents what the operating cycle permanently ties up, while receivables come in and inventories are sold off. It reaches 23.5 million. The net cash position is the gap between the two. It plunges to minus 28.26 million because 28.69 million of short-term financial debt stands against 0.434 million in the bank.
The diagnosis reads in a single sentence: the structure held together only through bank refinancing renewed again and again. A company in this position lives in dependence on short-term credit, and the slightest turning off of the bank tap can become fatal.
| Indicator (M EUR) | 2023 | 2024 |
|---|---|---|
| Net working capital | -4,14 | -4,77 |
| Working capital requirement | 21,3 | 23,5 |
| Net cash position | -25,43 | -28,26 |
| Short-term financial debt | 27,73 | 28,69 |
| Cash in the bank | 2,29 | 0,43 |
Signal 2: knowing how to interpret EBITDA
EBITDA tells you what operations generate before depreciation and provisions. It tells you neither how much nor when the money comes into the bank, and that is where many readings stop too soon.
The 2.55 million reported includes around 2.79 million of non-recurring income linked to disposals of trucks and equipment. Strip out these items that will not recur: adjusted EBITDA falls to minus 0.24 million. The core business was no longer producing any margin. An indicator can therefore look healthy in a given year thanks to a one-off event that masks the erosion of the recurring activity. The discipline lies in systematically separating what recurs from what will not recur.
Signal 3: the map of cash flows
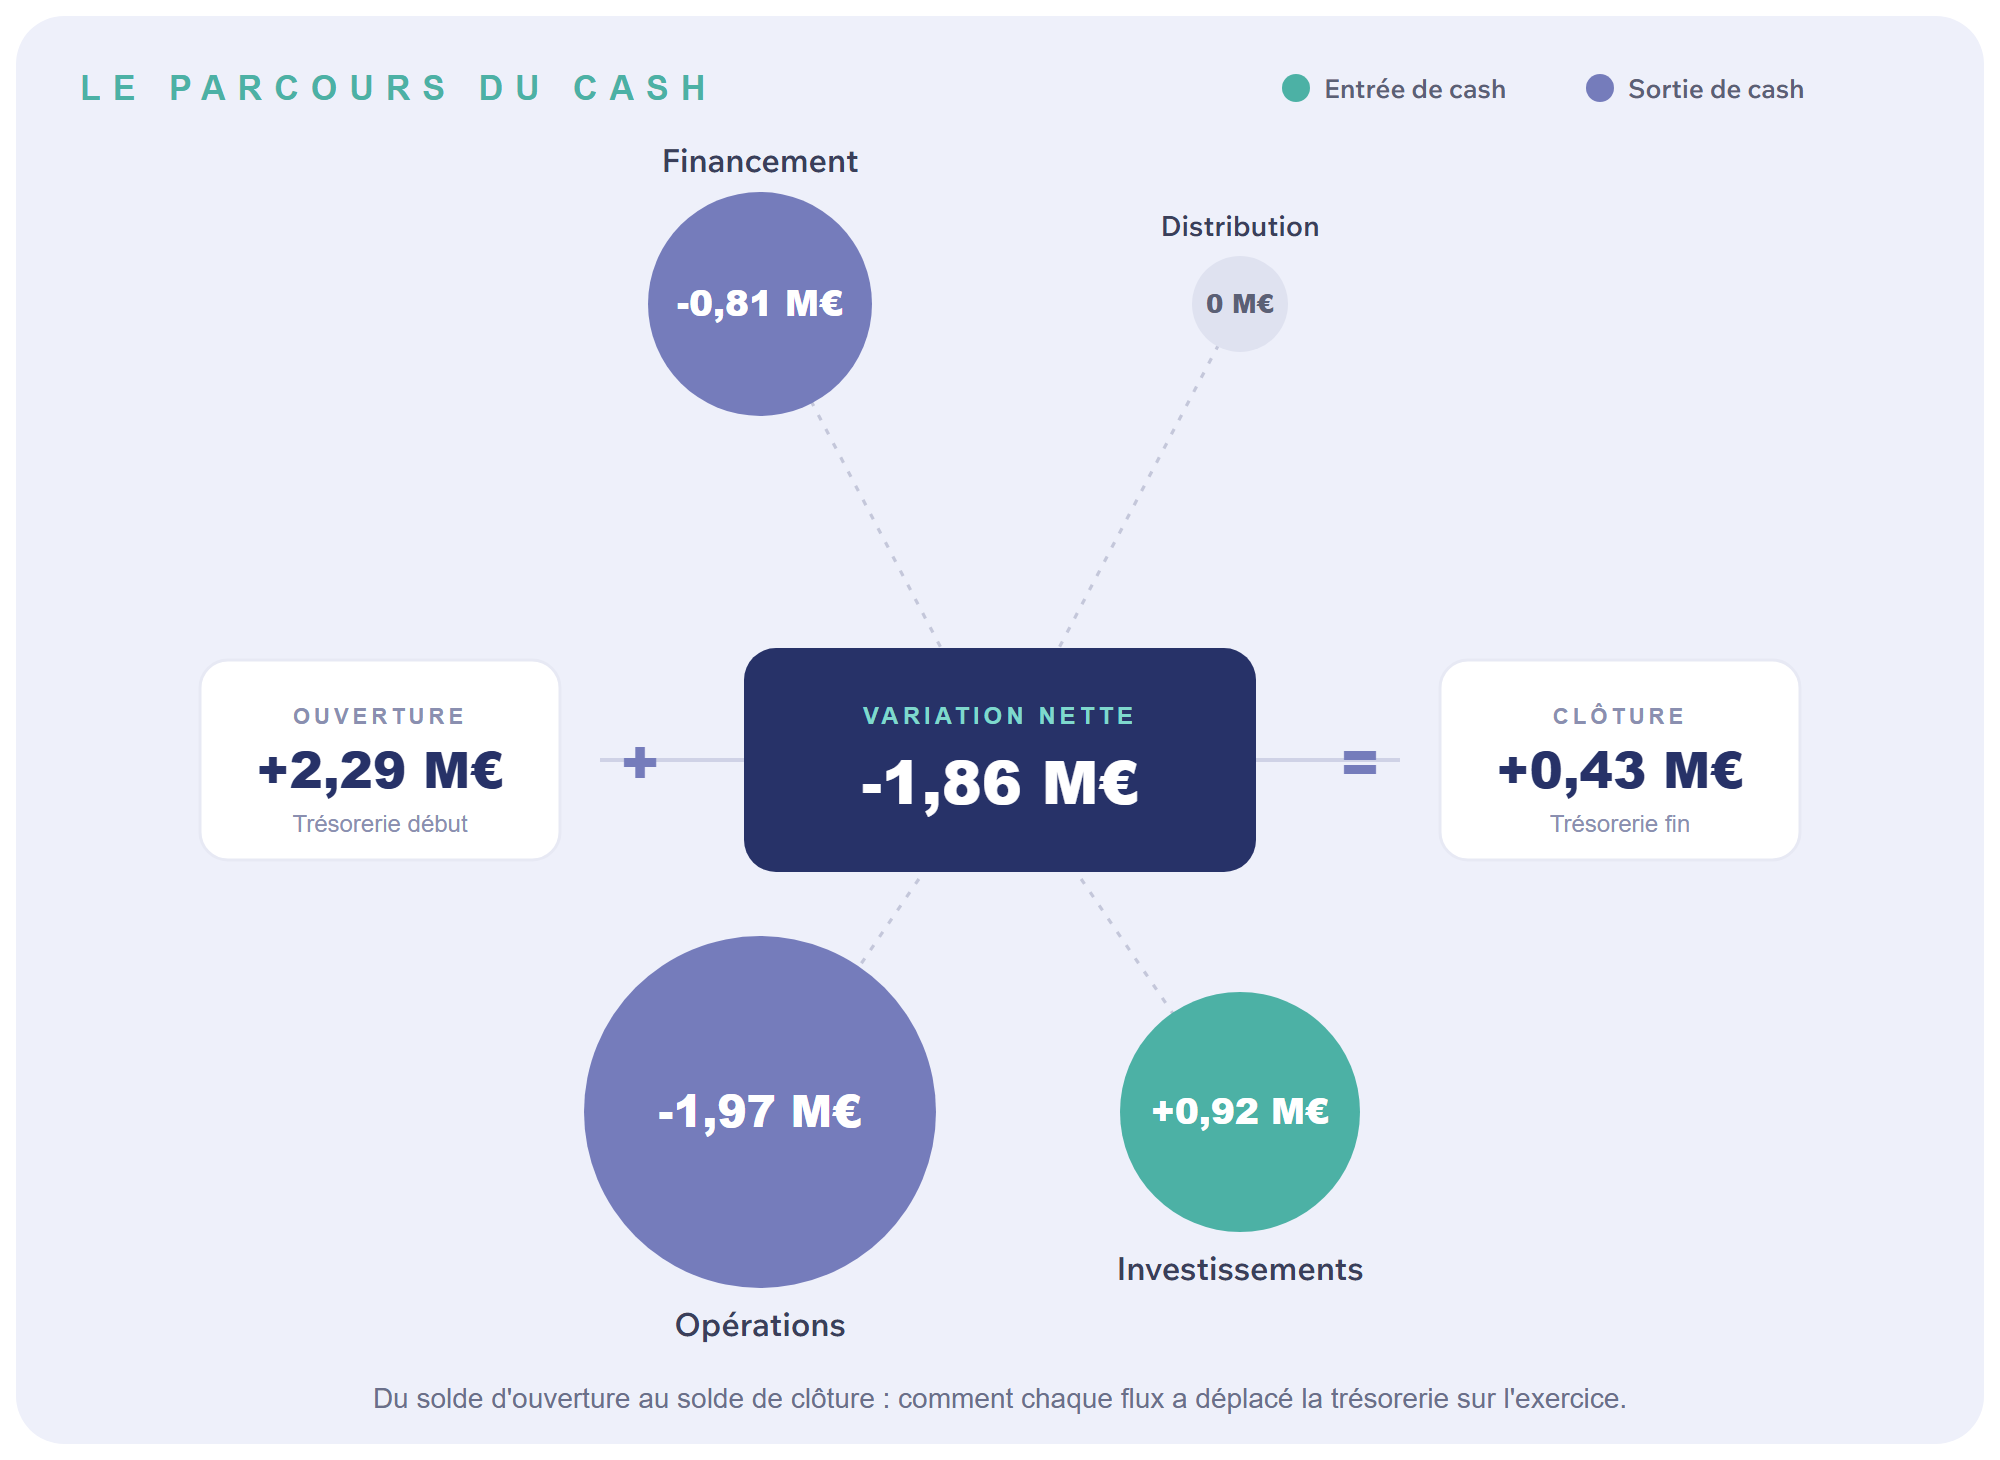
The change in cash over a financial year reads like a map. The opening cash position, increased by operating, investing and financing flows, gives the closing cash position. At Ziegler the cash position moves from 2.29 million to 0.434 million, a net change of minus 1.86 million over the year. Three flows tell this movement and we open them one by one.
The operating cycle and the working capital requirement
The operating flow swings from plus 5.36 million in 2023 to minus 1.97 million in 2024. In other words, the ongoing activity was losing money for the company: it was consuming cash. The working capital requirement drives this flow. The longer a company waits for its receipts, the more it finances its customers in their place. The average collection period rises from 159 days in 2023 to 182 days in 2024: six months to get paid, well above the norms of road transport.
One trap is worth heading off. In 2023 the change in the working capital requirement had contributed 4.22 million to the operating flow. Read quickly, this contribution looks like management that is improving. It is the opposite: when turnover falls, it mechanically carries fewer outstanding receivables and frees up cash without any period having shortened. The proof lies in the collection period, which remained at 159 days. In 2024 the period deteriorates further and the working capital requirement absorbs an additional 2.33 million of cash.
Investing cash flow
The investing flow turns positive in 2024, at 0.92 million. A positive investing flow is always intriguing, since investing normally consumes cash. The explanation is not a chosen slowdown in spending but asset disposals: the company was selling fixed assets. Selling off your means of production to finance day-to-day operations is not an investment: it is a strain signal in its own right.
Financing cash flow
The financing flow falls from plus 2.35 million in 2023 to minus 0.81 million in 2024. The shareholders did nonetheless support the structure: 14.8 million euros injected in 2023, then 5.0 million in 2024. But the long-term debt repayments, 7.07 million over the year, absorbed this effort. Without the 5 million contribution, the closing cash position would have been negative. When capital contributions no longer finance growth but staying afloat, the sustainability of the model is in question.
Why did Ziegler go bankrupt?
The immediate cause falls under the bankruptcy proceedings and any ongoing investigations, on which we do not take a position. The public account points to the surge in fuel costs and the state of the transport sector. This factor is real and we do not dispute it. But it struck an already weakened structure, and an external shock always does more damage to a cash position with no safety margin. Our point lies elsewhere: the three signals described were readable in public accounts, well before the bankruptcy filing.
A partial takeover was organised, Transuniverse Forwarding across seven sites and Van Moer for air freight, with around 282 of the 415 jobs safeguarded. We mention it for the completeness of the record, without judging either the receiver or the buyers.
What the case teaches us
A result is something you look at. A cash position is something you steer. The whole gap between what these accounts showed and what they gave to read lies in this distinction.
The lesson goes beyond this case. The cash culture is not a privilege of large groups, nor the business of a single chief financial officer. It is a governance reflex: read the structure of the balance sheet and the net cash position, restate EBITDA for one-off items, then follow the map of cash flows and the working capital requirement. The signals were public. All that remained was to read them in time.
Appendix: a reading framework for the analyst
To turn these three signals into a method, here is a framework applicable to any set of accounts.
| Element | What you look at | The right question | The warning signal |
|---|---|---|---|
| Balance sheet structure and net cash position | Net working capital, working capital requirement, net cash position, short-term debt against cash | Do my long-term resources cover my long-term assets and my cycle? | Very negative net cash position and permanent dependence on short-term refinancing |
| EBITDA | Reported EBITDA, then restated for non-recurring items | Does my margin hold without the one-off items? | Negative adjusted EBITDA |
| Operating cash flow and working capital | Operating flow, collection period, change in the working capital requirement | Does my activity produce cash, or does the working capital requirement absorb it? | Negative operating flow and a lengthening customer collection period |
| Investing cash flow | Real investments against asset disposals | Am I preparing for the future or selling my means of production? | Positive flow obtained by disposing of operating assets |
| Financing cash flow | Debt, capital contributions, repayments | Who is financing the structure, and for how long? | Repeated shareholder contributions just to stay afloat |
Your numbers have more to say than you imagine
SAGORA reads your accounts the way this article reads another company's: the structure of your balance sheet and your net cash position, your EBITDA restated for one-off items, the map of your cash flows, your operating cycle and your working capital requirement. A logical, structured analysis, element by element, that brings strains to the surface before they become hard to reverse. Let's talk.
Discover SAGORA's financial analysis for your company, free of chargeSagora Finance, editorial line. Article based on the Financial Diagnosis and Planning module (trainer: Prof. Mathias Schmit).
Source: Analysis drawn up from the statutory annual accounts of Ziegler SA (company number CBE BE 0403.480.507), 2024 financial year, filed with the Central Balance Sheet Office of the National Bank of Belgium on 11/07/2025 (filing ref. 2025-00275733). Public data reused in accordance with the NBB's terms of use. SAGORA is neither mandated by nor connected to Ziegler SA.
Disclaimer: This article is an educational exercise in reading public accounts, for informational and educational purposes. It constitutes neither investment advice nor a judicial expert opinion nor an opinion on the causes of the failure or on any liabilities, which fall to the receiver and the competent courts. It concerns the entity Ziegler SA, distinct from the Ziegler group and from the other entities involved in the proceedings. The opinions expressed here are stated as opinions.
www.sagora.eu
Related articles

Don't panic: why patience is your best ally in turbulent times
In 2020, the S&P 500 fell by almost 35% before rebounding just as fast. In turbulent times, the temptation to sell is costly: the real risk is not the decline, it is missing the few days that make performance.

Does a monkey invest better than you (or than Aunt Agatha)?
According to Burton Malkiel, even experts cannot beat the market consistently, because performance is largely unpredictable and comparable to chance.

Taming risk: a winning bet over the long term
Stock markets, comparable to waves according to Joseph Goldstein, are volatile by nature, forcing investors to learn to manage their fluctuations rather than simply endure them.