In 2020, following the Covid crisis, the S&P 500 tumbled by 34.9% (The North American Journal of Economics and Finance) over the year. Your first reaction may have been to panic and sell to limit the damage. But is giving in to temptation the best strategy for a better long-term return?
The cost of repeated trading
Several elements of theory indicate that, in general, the investors who achieve the best returns are those who sell and buy least often. It has been shown (Dalbar QAIB, 2024) that the portfolios of American investors performed on average 5.5% below the S&P 500. This difference is explained by ill-timed buying and selling, which can precisely happen more often in times of crisis when markets are on a rollercoaster. These emotional rather than rational reactions, triggered by a sense of fear, together with transaction costs, account for this performance gap.
The few days not to miss
What is more, let's take a historical perspective: market performance is for the most part explained by just a few days alone. Selling in haste means taking the risk of missing these strategic days.
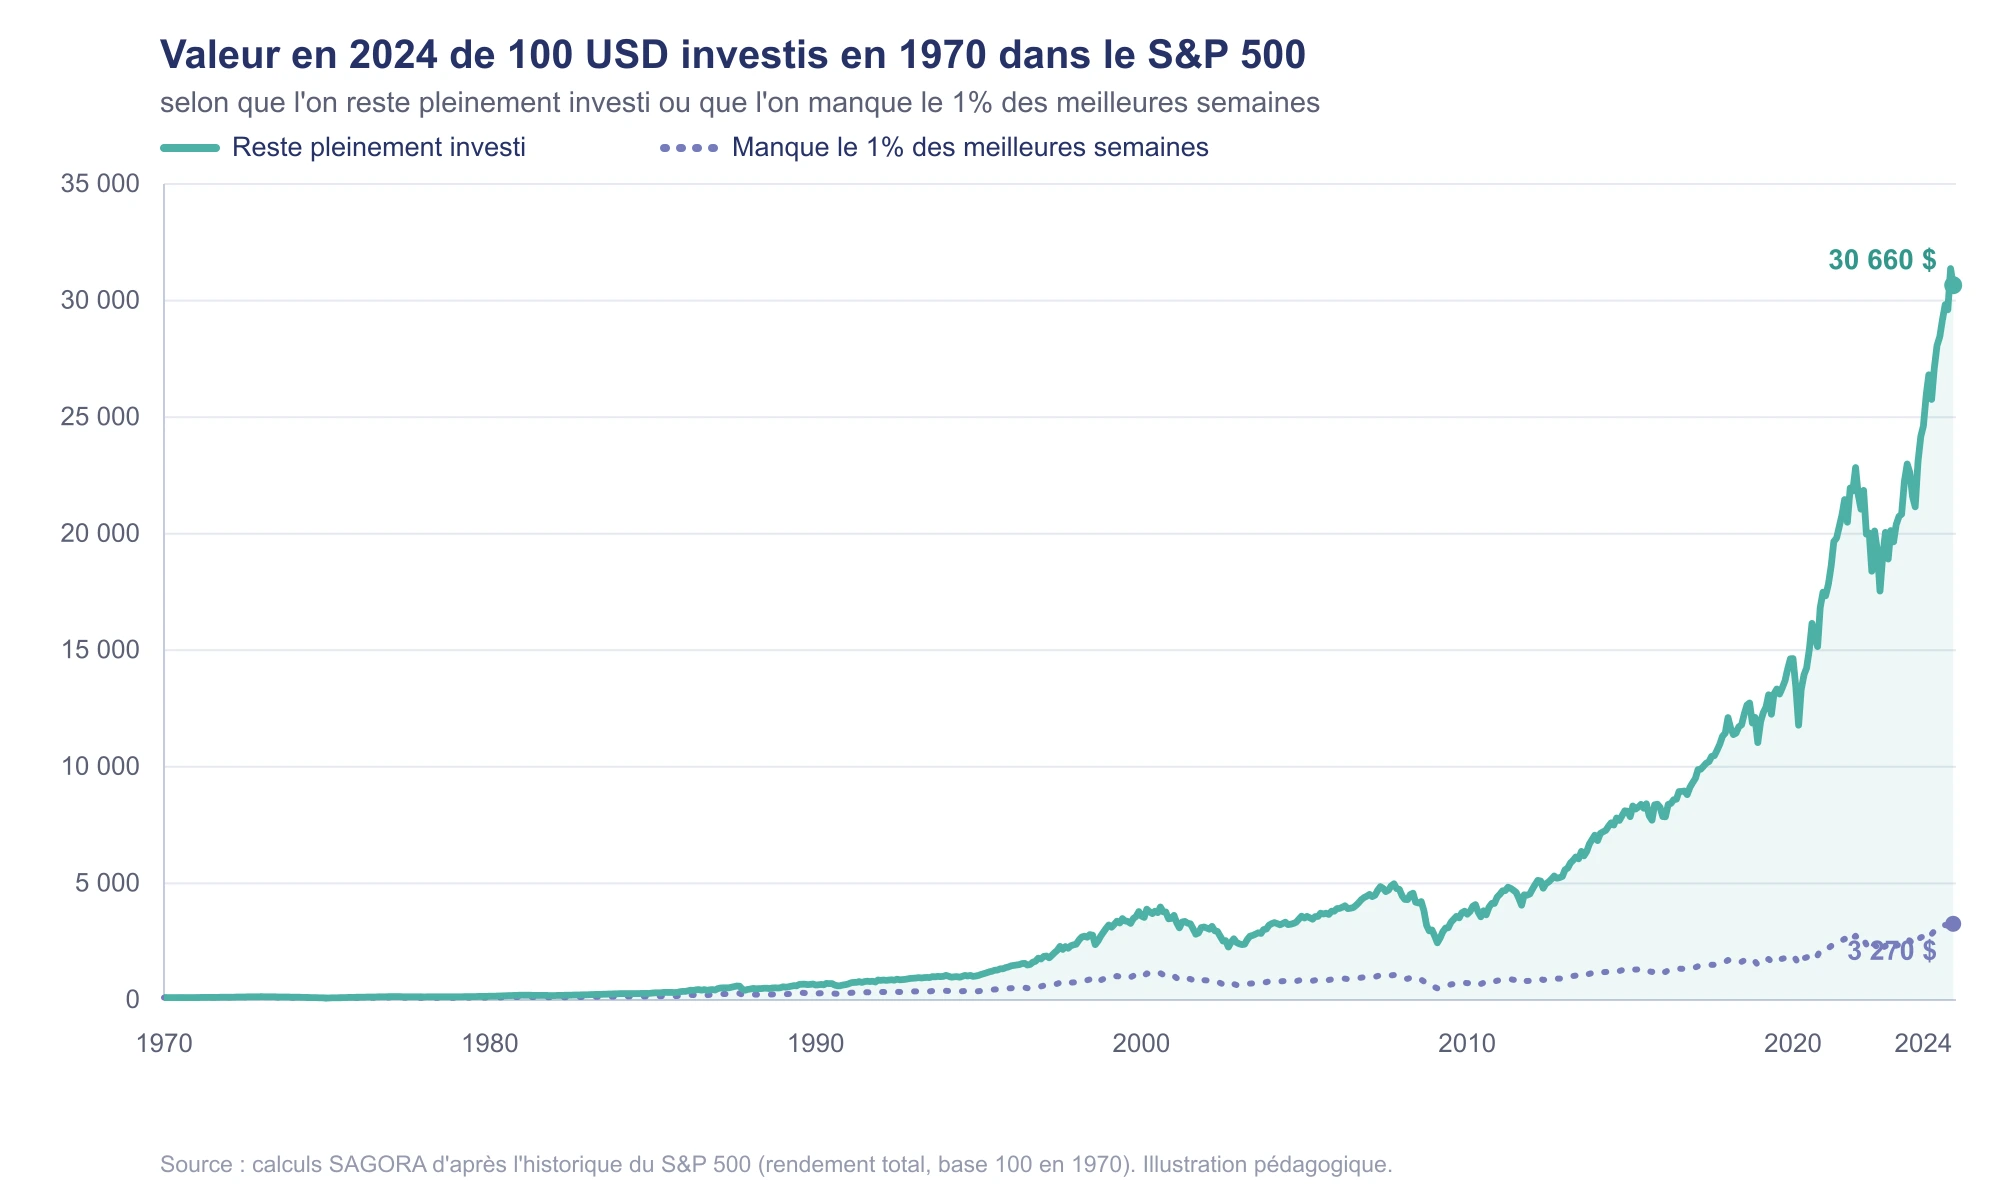
The chart below shows it clearly: missing the top 1% of weeks is terribly costly. We can see that the 2024 value of 100$ invested in 1970 in the S&P 500 is 30,660$. By contrast, if you miss the top 1% of weekly returns, the value falls to 3,270$.
The returns of calm investors
Let's come back to our example of the 2020 fall. This sharp drop was followed by rebounds just as dramatic: between 2020 and 2024, the four best trading sessions were concentrated in just three weeks. This concentration of performance highlights a major issue for the investor: whereas constant exposure generated an annualised return of 13%, the portfolios that recorded capital outflows during this peak of panic show a performance of only 2.8%.
Historically, the return gap observed highlights that capturing value rests on continuous exposure, allowing investors to benefit from the recovery phases that follow periods of high volatility.
Sources: Dalbar, QAIB (2024); The North American Journal of Economics and Finance; chart: Bloomberg, Bank of Singapore.